This is a blog like article with a FAQ for d3web developers transitioning from Eclipse to IntelliJ IDEA:
Table of Contents
- Create a new Plugin-Module
- Import current code styles
- Add copyright header
- Adding new files and classes to version control automatically:
- Save actions like in eclipse
- Show Javadoc
- Use Identical Path for JUnit and Maven Testing
- Running Headless-App-Tests in JUnit
- Sorting of import statements
- Get Javascript code completion for jquery or other JavaScript Libraries
- NotSerializableException on Tomcat startup
- Debugging one thread of many
- View all compile errors of the project/workspace
- Java dock entries on OSX
Create a new Plugin-Module#
- right click on the respective parent module
- "new" -> "Module"
- select "Maven"
- select no archetype when asked
- Enter the name of your plugin for "Module Name"
- Change the entry of "Content root" using the "..." button, create new subfolder within the parent module named according to your plugin name, select this folder for "Content root" and "Module file location"
- hit next/finish
- (if your intelliJ is not configured to auto-import maven modules:) Import the project as maven module
Import current code styles#
Download the attached code_styles.jar and import them with File -> Import settings.
Add copyright header#
Download the attached copyright.txt and add it the following way:
 |
The provided copyright.txt is for the denkbares GmbH, but can easily be changed to other firms or e.g. the university.
Adding new files and classes to version control automatically:#
Go to File -> Settings -> Version control -> Confirmation -> When files are created. You're probably looking for "Add silently".
Save actions like in eclipse#
Edit -> Macros -> Start macro recording
Now we record the actual macro simulating our Save actions:
- Code -> Reformat Code (formats the code according to the code style/template, also allows to optimize inputs)
- File -> Save all
- Build -> Compile (compiles the changes which also causes them to be hot swapped when in debug)
Edit -> Marcros -> Stop macro recording
After that, I bound the macro to "Cmd + Alt + S". This way I still have the normal save, but also the macro which does more...
Show Javadoc#
Use View -> Quick Documentation or the corresponding keyboard shortcut (depends on OS and Keymap).On Mac OSX with Eclipse keymap, F2 Works.
It's also possible to enable automatic JavaDoc popup on code completion in Preferences -> Editor -> Code completion (Autopopup documentation).
At the beginning this worked for me (somewhat clitching), but now it no longer works :(
Use Identical Path for JUnit and Maven Testing#
Unfortunately JUnit in IntelliJ IDEA has a different path for executing JUnit tests in modules as it will have when testing in maven builds. You can change this unwanted default behaving by setting the default JUnit path in the Run Configuration default settings for JUnit:Open Menu Run->Edit configuration and there go to Defaults->JUnit->Working directory and set the value to $MODULE_DIR$.
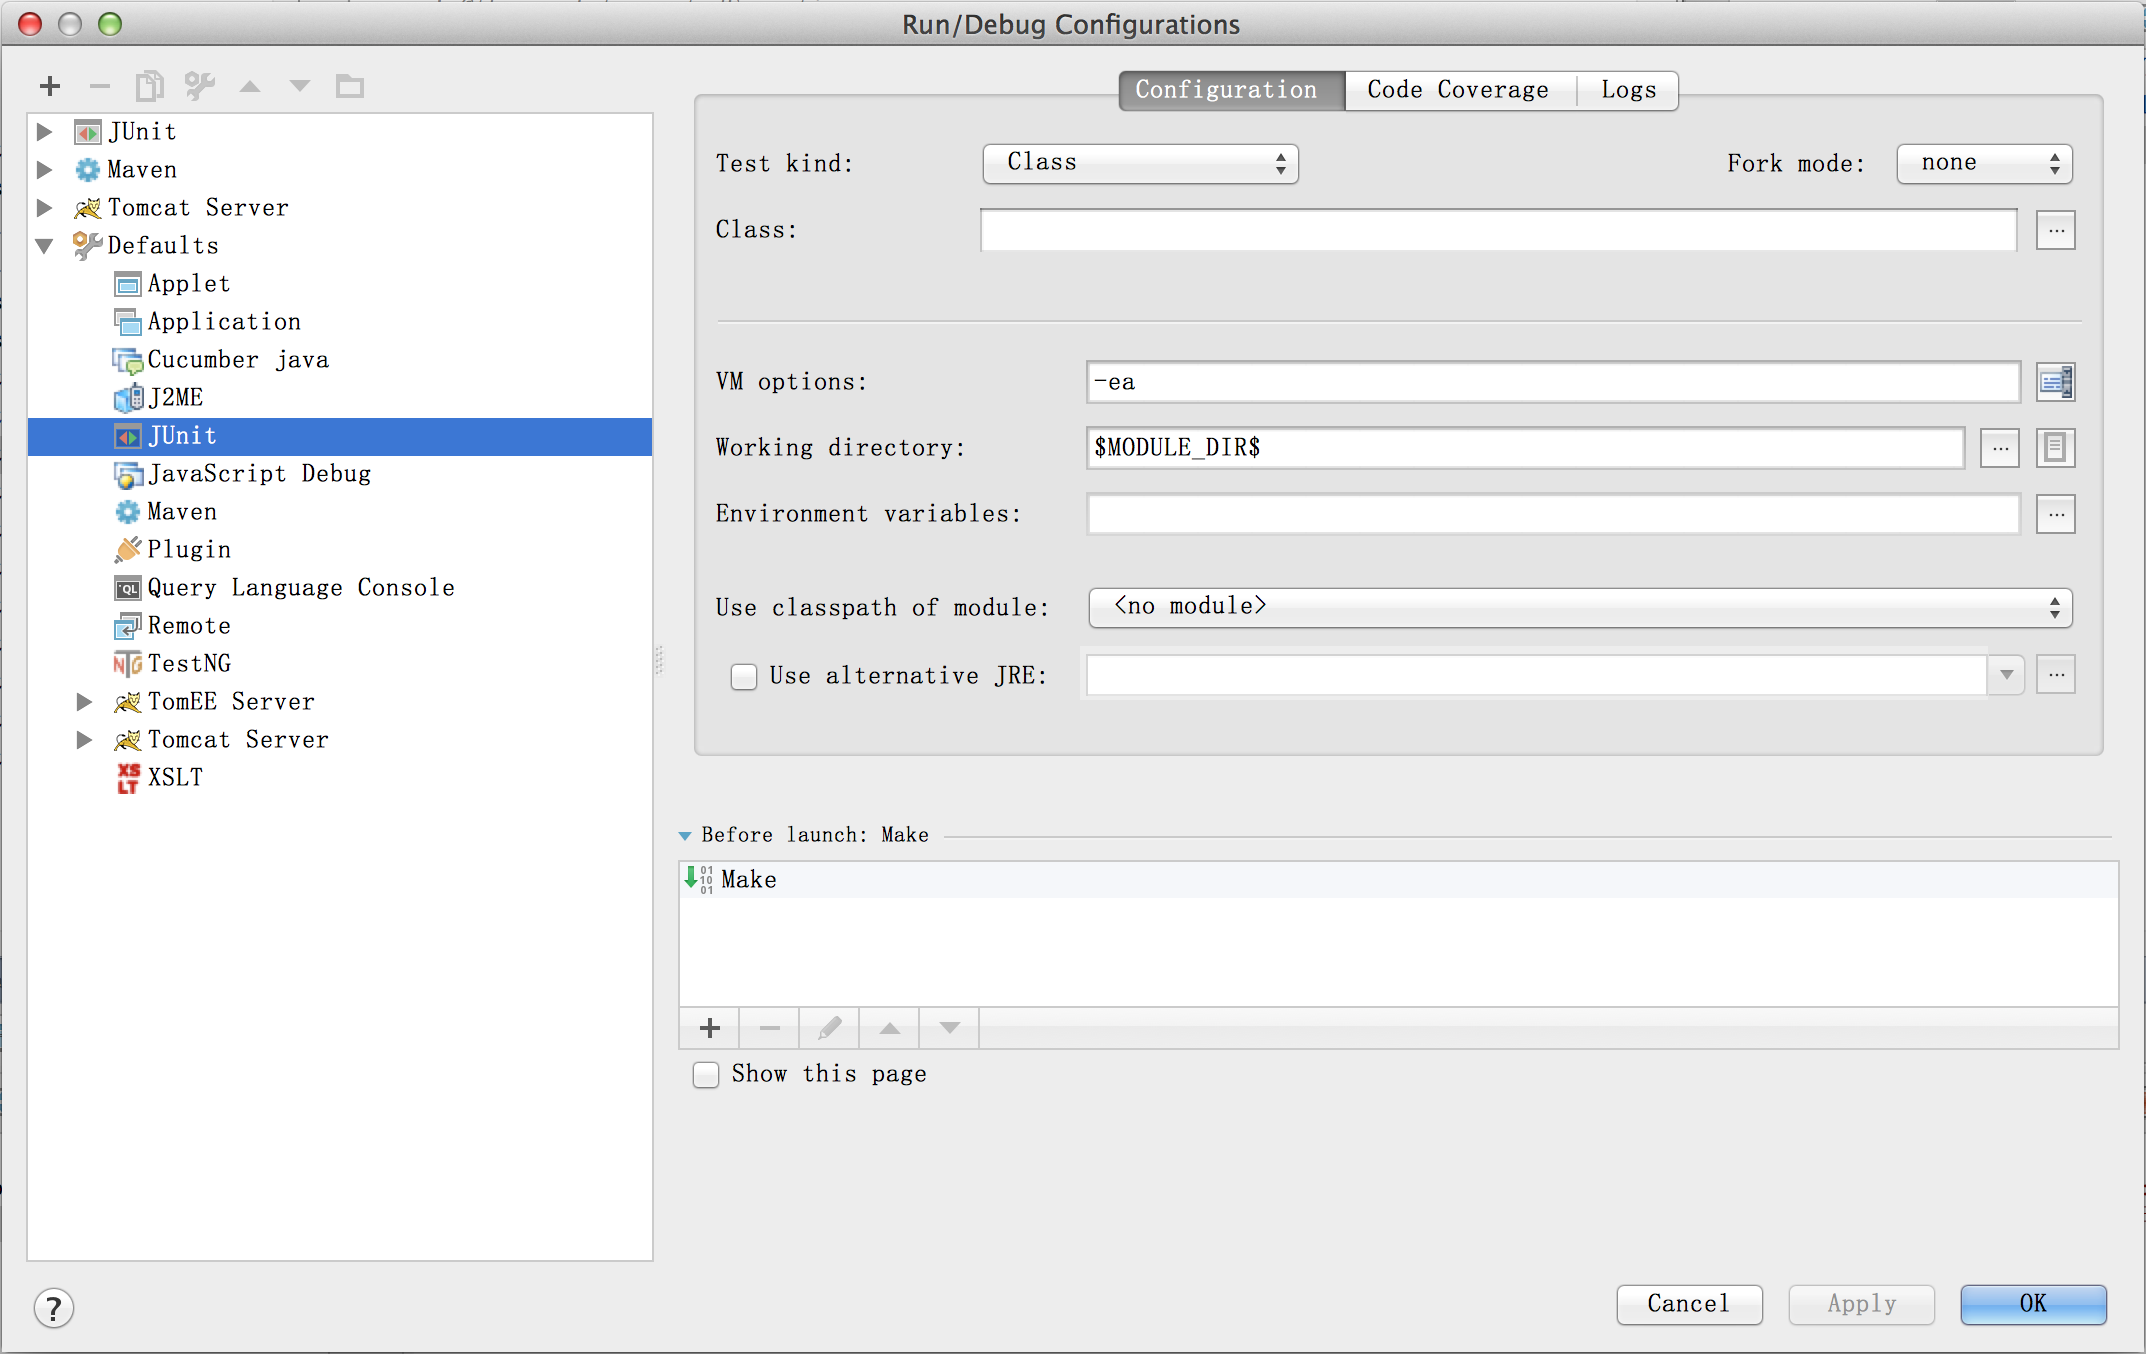 |
After that IntelliJ IDEA will set the relative path in all JUnits just like Maven.
Running Headless-App-Tests in JUnit#
To run the Headless-App-Tests in JUnit (e.g. for debugging), create/add a new JUnit Configuration. In the configuration, make sure to use the settings displayed below. Make sure you select the Working directory of the "KnowWE-Headless-App", and select the classpath of the module "KnowWE-Headless-App". "Test kind" has to be "Class" and "Fork mode" has to be "none", otherwise debugging is not possible.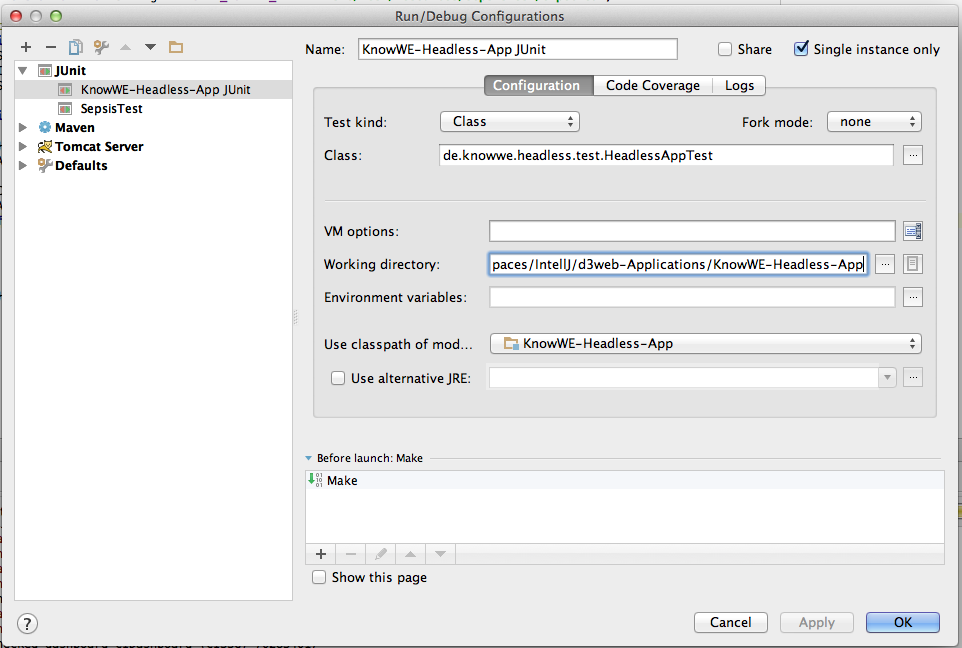 |
Sorting of import statements#
By default IntelliJ has different order of import statements as Eclipse. To avoid having these change every time a class is edited in the different IDEs, we should adjust the order in IntelliJ. This can be done under Code Style -> Java - > Imports. The order should be:- import java.*
- <blank line>
- import javax.*
- <blank line>
- import all other imports
- <blank line>
- import cc.denkbar.*
- import com.denkbares.*
- import de.*
- <blank line>
- import static all other imports
The above order will not quite avoid all changes, since Eclipse seems to additionally add blank lines between all imports with different first path elements, but this seems close enough for now. I think since it is a code style, this should also be part of the code style settings, which are also attached to this site.
Get Javascript code completion for jquery or other JavaScript Libraries#
- Open “Project Structure” dialog and choose “Global Libraries”.
- Click + button and choose “JavaScript” library type from the drop-down list.
- Specify your library name in the “Name” field.
- Open Settings|JavaScript| Libraries
- Enable jquery and choose all (parent) projects you want code-completion for
- Afterwards click "Manage Scopes" and check that jquery is defined at Project level
Attention: After adding files to your library, they become read-only in IntelliJ. You should only add files as global libraries that you will not change often. Otherwise you need to removed them from the library as long as you edit them or only use an external copy of the files.
NotSerializableException on Tomcat startup#
During startup KnowWE/Tomcat often produces exceptions of the following kind:
java.io.WriteAbortedException: writing aborted; java.io.NotSerializableException: com.ecyrd.jspwiki.auth.UserManager
    at java.io.ObjectInputStream.readObject0(ObjectInputStream.java:1351)
    at java.io.ObjectInputStream.defaultReadFields(ObjectInputStream.java:1970)
    at java.io.ObjectInputStream.readSerialData(ObjectInputStream.java:1894)
....
KnowWE still works, but the exceptions are annoying/irritating...
In eclipse it was possible to delete the work-folder in KnowWE-App, but in IntelliJ that does no longer work.
The solution is actually pretty simple, just deactivate session persistence in your Tomcat:
- Open file "%Tomcat_Home%/conf/context.xml"
- To disable the session persistence, uncomment the line <Manager pathname="" />
Debugging one thread of many#
For developers migrating from Eclipse to IntelliJ, the default behavior of breakpoints in IntelliJ might be unexpected. While Eclipse only suspends the thread that reached the breakpoint, IntelliJ also suspends all other threads when a breakpoint is reached.This behavior can simply be changed in the settings of the breakpoint: Open the breakpoints panel in the debugger an navigate to your breakpoint. Right to the checkbox "Suspend" select the radio-button "Thread" instead of "All". On the right side of the panel you can also make this setting the default.
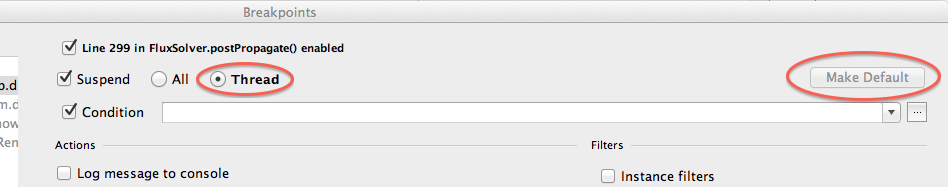 |
View all compile errors of the project/workspace#
IntelliJ does not have a view showing all current compile errors like Eclipse did, because it does not compile automatically on each change of the code.For me, the best replacement so far has been the following:
- In the settings, search for "Java Compiler" and select "Eclipse" as compiler.
- Make sure that "Proceed on errors" is checked
If you now want to see all compile errors, e.g. after a "dirty refactoring":
- Go to "Build" and "Make Project". It may take a few seconds, but not many (< 10s for me). If you made changes with big impact in Eclipse, it would also compile for some time...
- You now see the errors and warnings in the Messages view and can go through them. You can hide warnings with a button in the tool bar of the view.
- Alternatively, select scope "Problems" in the Project view. Unfortunately this does not show all existing compile errors, but only the ones of the files you have already viewed.